First, the industry definition
Clothing home textile refers to the production and sales of clothing and home textile products. Pengyuan Credit Rating Co., Ltd. (hereinafter referred to as “Pengyuan†or “weâ€) recognizes the standards of apparel home textile enterprises as follows: When the proportion of business income from the company’s clothing and home textile products is greater than or equal to 50%, it is classified into clothing. Home textile industry; when the proportion of operating income from the company's clothing and home textile products is less than 50%, but its income and profits account for the highest proportion of the business structure, and they account for 30% or more of the company's operating income and operating profit, It belongs to the clothing home textile industry.
Second, industry analysis
Apparel textile industry have been expanding, has played an important role in solving the employment, exports, etc., is an important part of the national economy
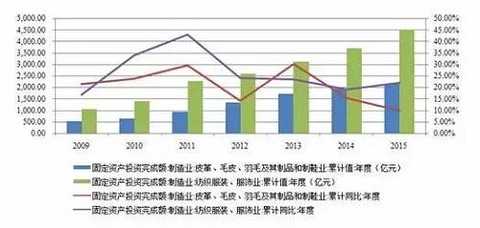
China is the world's largest consumer and producer of garments. After experiencing high growth in 2010 and 2011, the growth rate of fixed asset investment in the apparel and home textile industry has declined overall since 2012, but it still maintains rapid growth. In the past three years, the growth rate of fixed assets investment in textiles, garments and apparel industry was 23.57%, 19.20% and 22.00% respectively. The growth rate of fixed assets investment in leather, fur, feathers and their products and footwear industry was 30.31%. 15.60%, 10.00%. Compared with other industries, the clothing and home textile industry has the characteristics of relatively small investment, relatively low technology content, and relatively quick investment. Therefore, the clothing and home textile industry is still the target of actively encouraging investment in some places, especially in the central and western regions.
Figure 1 China's textile and apparel, apparel industry and investment in fixed assets
|
Source: wind, Peng Yuan finishing
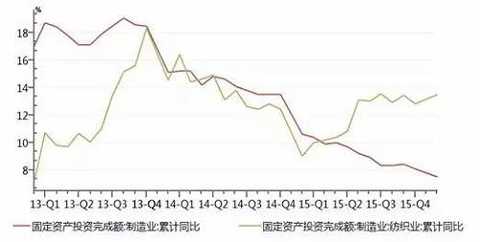
Driven by the rapid growth of the clothing and home textile industry, China's textile industry investment continues to grow, and the scale of the industry is still expanding. According to the National Bureau of Statistics, in 2015, China's textile industry's fixed assets investment of more than 5 million yuan completed a total of 1,911.3 billion yuan. It increased by 15.0% year-on-year, ahead of the national manufacturing industry's 8.10% growth rate of 6.9 percentage points. The expansion of clothing home textiles and textile manufacturing industry has provided a large number of jobs. According to statistics, an average of 932 people can be employed in fixed assets investment per 100 million yuan, while textiles and clothing can absorb 1,876 people and 4,464 people respectively. By the end of 2015, there were 20,500 textile enterprises in the country and 4.487 million employees in the textile industry, which played a major role in solving the employment of residents.
Figure 2 Growth rate of fixed assets investment in the textile industry from 2013 to 2015 (unit: %)
|
Source: wind, Peng Yuan finishing
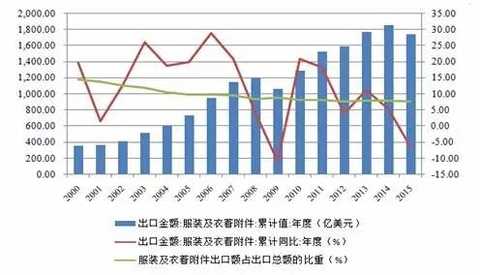
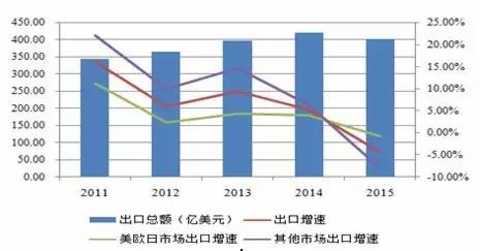
As a world clothing exporting country, China has an important position in the international clothing trade. The clothing industry has been a major exporter of foreign exchange in China for many years. In 2000, the export value of China's clothing and clothing accessories was US$360.20 billion. In 2015, it reached US$174.28 billion. In the fifteen years, the export volume increased by 4.84 times, becoming the world's largest producer and exporter of textiles and clothing.
Figure 3 Exports of China's garments and clothing accessories from 2000 to 2015
|
Source: wind, Peng Yuan finishing
Never seen, China's overall economic environment will not change greatly in the short and medium term, and the clothing and home textile industry will maintain a certain growth. The clothing and home textile industry will still occupy a more important position in the national economy.
Affected by the slowdown in domestic and overseas market economic growth, domestic consumption structure adjustment, exchange rate fluctuations, etc., the market demand for clothing and home textile industry has weakened.
(1) Domestic market
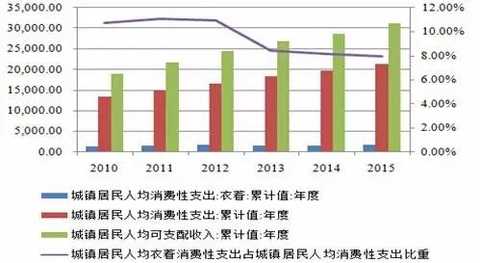
In recent years, China has continuously promoted the urbanization process. By the end of 2015, China’s urban population had reached 771 million people, and the urbanization rate reached 56.10%, an increase of 1.33 percentage points year-on-year; per capita disposable income and per capita consumption expenditure of urban residents increased steadily, 2015 The per capita disposable income of urban residents in China was 31,195 yuan, an increase of 8.15% over the same period of the previous year. In 2015, the per capita consumption expenditure of urban residents in China was 21,392 yuan, an increase of 7.13% over the same period of the previous year. The increase of residents' income level has created certain favorable conditions for increasing the demand for clothing consumption. However, the proportion of expenditure on housing and medical care in the consumption structure of residents has been increasing year by year. Since 2012, the per capita consumption of clothing consumption of urban residents in China has accounted for per capita consumption of urban residents. The proportion of sexual expenditure continued to decline, and in 2015 this proportion fell to 7.95%.
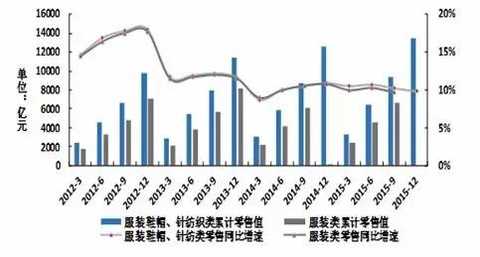
With the development of urbanization and the increase in per capita disposable income, the absolute value of sales in China's apparel industry continues to grow. However, in terms of growth rate, affected by factors such as macroeconomic downturn, consumption structure adjustment, and slowdown in domestic demand growth, the growth rate of apparel retail sales has shown a downward trend since 2014.
Figure 4 Percentage of per capita disposable income, expenditure and clothing consumption of urban households in China (Unit: Yuan)
|
Source: wind information, Peng Yuan finishing
Figure 5 Domestic textile and apparel retail sales in 2012-2015
|
Source: National Bureau of Statistics official website, Peng Yuan finishing
(2 foreign market aspects
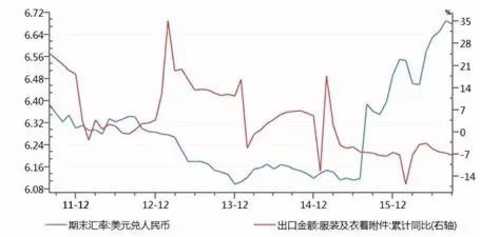
Since 2014, the RMB exchange rate has continued to depreciate. As of October 12, 2016, the RMB exchange rate against the US dollar was 6.73, a record low in six years. In theory, the continued depreciation of the RMB has provided certain good external conditions for China's garment export enterprises. However, compared with the renminbi, the currency depreciation of Southeast Asian countries is even stronger, and the cost of labor is cheaper. When the relevant enterprises sign export orders, the international traders will consider the depreciation of the renminbi and lower the price. Therefore, the decline in exchange rate has a very limited effect on stimulating the growth of China's textile and apparel exports. Since March 2015, China's garment export situation has not been very optimistic. As can be seen from the following figure, the export value of clothing and clothing accessories has been in a negative growth state. The growth rate of export volume of home textile products has slowed down year by year since 2013 and has shown negative growth. According to the latest statistics of China Customs, the total export of China's textile products in 2015 was 40.23 billion US dollars, down 4.4% year-on-year.
Figure 6 China's RMB exchange rate and clothing clothing export growth rate in recent years
|
Source: wind information, Peng Yuan finishing
Figure 7 Export of China's textile products
|
Source: China National Textile Association official website, Peng Yuan finishing
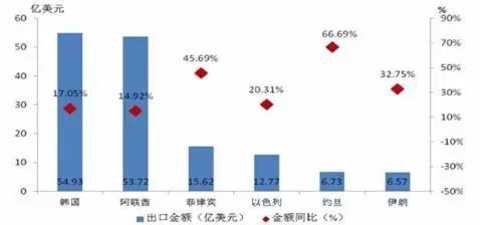
Affected by the implementation of the “ Belt and Road †strategy and the deepening of China-Africa cooperation, China’s exports to some emerging markets have achieved rapid growth, and new export markets are being developed and nurtured. According to customs statistics, from January to November 2015, China’s apparel exports to Africa increased by 10.84% ​​year-on-year, accounting for 5.78% of the total export value, an increase of 0.96 percentage points over the same period of 2014. Among the countries along the “Belt and Roadâ€, China South Korea, the United Arab Emirates, the Philippines, Israel, Jordan, and Iran increased their export value by 17.05%, 14.92%, 45.69, 20.31%, 66.69%, and 32.75%, respectively. However, the total export value of the five countries was US$15.034 billion, accounting for only 9.48% of the total export value of China, which had little impact on the overall export situation.
Figure 8 China's exports to some emerging markets from January to November 2015
|
Source: China Customs
The weakening of the RMB exchange rate and the rapid growth of exports in some emerging markets have limited short-term effects on China's textile exports. The consumption power of the international market is the key. The traditional export destinations of China's garment home textiles are mainly concentrated in the three regions of the United States, Europe, and Japan. The economic conditions of the United States, Europe, and Japan directly affect the export of garments and home textiles in China. Since the financial crisis, the economies of the United States, Europe, and Japan have been hit hard. Although they have gradually recovered in recent years, they have only slowly moved forward. Specific to the consumer level, US retail sales in 2015 increased by 2.6% year-on-year, up 1.2 percentage points over the same period in 2014; Japanese retail sales fell by 1.1% year-on-year; retail sales in the euro zone increased by 1.4% year-on-year, down 1.5% from the same period last year.
Figure 9 Year-on-year growth rate of retail sales of the three major economies from May 2014 to December 2015
|
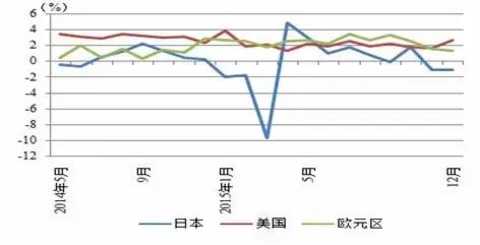
Source: National Bureau of Statistics, Peng Yuan
The US GDP growth rate and consumption growth have created a good external environment for the export of China's garment home textile products, but the European and Japanese markets are still in a downturn, affecting the overall growth rate of China's garment exports. According to national customs data, China's textile and apparel and clothing accessories in 2015 Exports were US$ 174.68 billion, down 6.4% year-on-year. Among them, exports to the US grew by 6.7%, exports to the EU fell by 9.3% year on year, exports to Japan fell by 11.6%. At the same time, Sino-US trade frictions have been raging in recent years. Trade imbalances, special textiles protection, and anti-dumping against China constitute the main content of Sino-US trade frictions, which will continue to have a negative impact on China's foreign trade.
The continuous decline in the growth rate of garment exports is related to the lack of demand in the international market, the sharp depreciation of the euro and the yen, and the shift in domestic production capacity to promote trade transfer. In addition to the above factors, future garment exports will also be affected by global regional trade liberalization. China's garment export growth or zero growth or even negative growth may become a new normal .
The entry threshold for the clothing and home textile industry is lower, there are more enterprises in the industry, and the competitive pressure is increasing.
Textile apparel industry is a labor-intensive industry, the lower the market access threshold, many enterprises in the industry, as of the end of 2015, the number of domestic textile and garment enterprises up to 15,585 homes, 2011--2015 compound annual growth rate of 8.69 percent.
Men's wear is an important part of the clothing market. China's men's wear industry has formed a “Zhepai†men's wear industry cluster represented by Shanghai, Ningbo and Wenzhou in Jiangsu, Zhejiang and Shanghai. It is represented by Jinjiang and Shishi in southeastern Guizhou. The men's wear industry cluster and the Guangdong South Pearl River Delta men's wear industry cluster that grow independently through the advantages of Hong Kong and Macao. After more than 30 years of development, China's men's wear industry as a whole is in a state of complete competition. There are many brands in the market. The domestic men's wear brand includes seven wolves (002029, stocks), newsbirds (002154, shares), Sinor (002485 , stocks), Youngor (600177, shares it), red beans shares (600400, shares it), Jiu Muwang (601566, shares it) and Shanshan. At present, international brands are mainly concentrated in the high-end market of first- and second-tier cities, and domestic men's wear brands are mainly in second- and third-tier cities. Driven by the rapid expansion of the consumer market, the domestic menswear market has grown rapidly. However, due to the low barriers to entry, there are many domestic menswear manufacturers, and the competition in the men's wear market in China is intensified due to the financial crisis leading to sluggish demand and the impact of a large number of international brands entering the domestic market. According to the data of the China National Business Information Center, in 2014, sales of men's apparel products of 100 major retail enterprises nationwide fell by 3.10% year-on-year. In 2015, the sales of men's apparel products of key national large-scale retail enterprises decreased by 1.2% year-on-year, while the retail sales of apparel products decreased by 0.3% year-on-year.
According to the “2015 China Fashion Industry Consumption Trend Research Report†released by Taobao, in terms of consumers, the overall male-female ratio in the apparel industry is about one to three, and women are the largest consumer groups. The women's market segmentation is relatively high, and the market concentration is low. According to the Euro monitor statistics, the retail sales of women's clothing in China was about 85 billion in 2014, while the market share of the top ten brands of high-end women's clothing was only 25.2%. . In the women's value chain, the design accounts for about 40%, the marketing channel accounts for about 50%, and the production accounts for about 10%. That is, the design and marketing are at the top of the clothing value chain, and the production and processing are at the bottom of the value chain, although the women's wear in China is in production. The processing field has cost advantages, but there is still a big gap between the R&D design, sales channels and brand operations and the international advanced level. Despite this, the domestic women's wear industry has initially formed a small number of local brands, such as Mars Phil, Langzi, Vignas (603518, shares), songs (603,808), ç‚莱蒂尔 (Hong Kong), etc. . This type of enterprise is mainly engaged in self-owned brand women's wear. It has strong R&D and design strength. After years of development and accumulation, it has established a relatively complete marketing network, with certain popularity and relatively stable consumer groups, and gradually established a competitive advantage.
According to the "China Youth Casual Wear Industry and Market Analysis Report" released by the China Textile Planning Research Association, the youth casual wear industry can be divided into two categories: the first two categories and the third and fourth categories. From the perspective of market structure, international brands are basically concentrated in the first- and second-class markets. Their brands and prices are positioned at the mid-to-high end, and there are high requirements for store design. It is expected that international brands will not see penetration into the third- and fourth-class markets in the short term. Meibang, Senma, and pure independent brands have been developing in China for many years. In the first and second markets, a relatively complete marketing network has been established, which has become the leading force in the domestic first- and second-class markets. However, with the influx of more and more international leisure brands, as well as sports brands such as Adidas and Nike gradually infiltrating into casual wear, the competition in the first and second categories has intensified, and the profitability of self-owned brands in the first and second markets has gradually declined. Therefore, some independent brands with brand advantages, financial strength and cross-regional operational capabilities began to penetrate into the market of the third and fourth categories. Fashion and casual wear such as Smith Barney and Senma have more brand advantages than sports and casual wear such as Adidas and Nike. In recent years, they have continuously developed low-priced products and seized the low-end market. The price advantage of independent brands in the third-fourth market will decline. The pressure of competition is constantly increasing.
In the face of fierce competition in the industry, the drawbacks of the extensive development of domestically relying on traditional expansion of channel expansion are gradually exposed. Some apparel companies have experienced a decline in profits and a surge in inventories. Baozi, which has been a leading brand in the high-end women's wear industry, is also suffering from poor management. It was acquired and delisted in 2015.
Affected by the intensified competition in the industry and the rising cost of the clothing and home textile industry, the growth rate of the profitability of apparel enterprises has slowed down, and the operating performance of major enterprises in the industry has diverged.
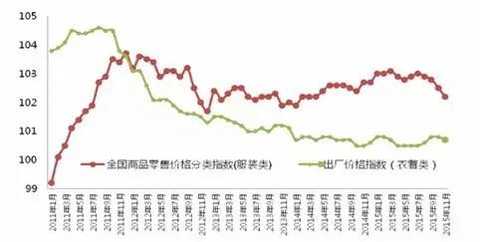
Affected by the increasing competition in the industry, some merchants have increased their discounts. In recent years, the ex-factory price index of apparel products has been declining. From the perspective of cost, both raw materials, sales expenses and labor costs have shown varying degrees of increase.
Figure 10 Changes in the consumer price index of clothing
|
Source: National Bureau of Statistics, Peng Yuan
Raw materials in recent years, China's apparel fabrics and fashion accessories overall price rise to Keqiao Textile price index, for example, Keqiao textile and apparel fabrics and fashion accessories price index rose by the beginning of 2010 to 98.97 and 93.23 at the end of 2015 116.91 and 125.89, the compound growth rate of 2010-2015 was 3.39% and 6.19% respectively. The increase in the prices of raw materials such as fabrics increased the operating pressure of the apparel industry.
Figure 11 Price index of Keqiao textile and apparel fabrics and apparel accessories at the end of 2010-2015
Textile Index by the State Department of Commerce and Economic and Trade Commission of Zhejiang Province, Shaoxing County, relying on Chinese textile city prepared release, is "src =" http://i3.hexun.com/2016-12-22/187452439.jpg "> |
Note: The Keqiao Textile Index was issued by the Ministry of Commerce, the Zhejiang Provincial Economic and Trade Commission and the Shaoxing County Government, based on the China Textile City.
A comprehensive index system that comprehensively reflects the development of China Textile City and Shaoxing Textile Industry.
Source: wind information, Peng Yuan finishing
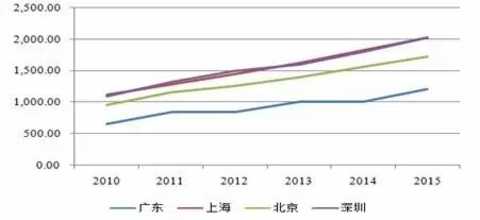
At the same time, rents, channel fees, and labor costs have increased in recent years, which has also squeezed the profits of the apparel industry. According to the results of the China Garment Association's special survey on the operating costs of garment enterprises, the operating costs of garment enterprises have gradually increased, among which labor costs have risen the fastest, especially the cost of sewing workers has continued to increase in the past decade, and the amount of social security has increased rapidly. Although China's current labor supply exceeds demand, but because migrant workers occupy a considerable proportion of textile enterprises in various places, "difficulties in recruiting workers" is still a major problem facing the textile industry every year. For example, in the more than 4,000 textile and footwear enterprises in Changzhou, Jiangsu, the number of migrant workers exceeds 500,000, accounting for nearly one-third of the total number of migrant workers in the region. In recent years, the gap in migrant workers in the Pearl River Delta region has increased significantly, while the number of migrant workers in cities such as Shanghai and Hangzhou has gradually increased. In addition, over the years, local minimum wage standards have been raised, increasing the labor costs of the textile industry.
Figure 12 Monthly minimum wage standard in major regions of China (yuan/month)
|
Source: wind, Peng Yuan finishing
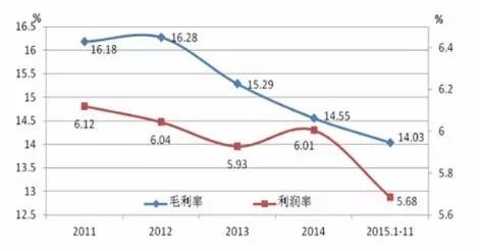
Affected by the continuous decline in product prices and rising costs, the overall profitability of the apparel industry continued to decline. The gross profit margin of the industry continued to drop from 16.28% in 2012 to 14.03%, and the profit margin fell from 6.04% to 5.68%.
Figure 13 Changes in the profit rate of the apparel industry
|
Source: National Bureau of Statistics, Peng Yuan
Under the background of the decline in overall profitability, the performance of large-scale garment enterprises is relatively stable, while the performance of small-scale enterprises is highly volatile, and the polarization of profitability is more obvious. For example, in the men's wear industry, Haishu Home and Youngor achieved a total operating income and net profit of 17.229 billion yuan and 4.843 billion yuan, accounting for 73.38% and 86.18% of men's wear business income and net profit, respectively, and the average net profit margin was 28.10. %. In the other nine companies, 8 companies have a net profit decline, and three companies have suffered losses. Among the profitable companies, the net profit is at least 27 million yuan, and the highest is 266 million yuan. Among the women's wear, “La Chapelleâ€, “Senma Apparel†in casual wear, and “Anta†in sportswear are all in a leading position in their respective fields, and their relative market share is relatively high.
The development of e-commerce and the liberalization of relevant policies have brought new challenges and opportunities.
In recent years, China's e-commerce has developed rapidly, online shopping has gradually emerged, and total network consumption has grown rapidly. In 2014-2015, the total online retail sales in the country was 278.98 billion yuan and 3.877 billion yuan, up 49.70% and 33.30% respectively. According to the National Bureau of Statistics, retail sales of wearable goods networks increased by 21.4% year-on-year. Domestic representative businesses include Taobao, Tmall, and Jingdong Mall. According to Alibaba.com, as of June 30, 2015, the annual active buyers on China's retail business platform reached 367 million, an increase of 32% year-on-year. On average, more than 50 orders were placed per active user per year. As of March 31, 2016, the annual active buyers of China's retail platforms increased to 434 million. In 2016, the total global transaction volume of Tmall Double 11 exceeded 120.7 billion yuan. In the next few years, China's online retail market still has a lot of room for growth. According to research data from iResearch, online retail sales account for only 7.9% of China's total retail market; by 2016, China's online retail market is expected to reach 11.5%, with a scale of 3.79 trillion yuan. In addition, with the construction of national logistics systems and the upgrading of urban and rural broadband networks, the use of smart phones and portable tablets is becoming more and more common, and the application of various online shopping apps is becoming more and more perfect. Under this background, the consumption habits of domestic consumers are gradually increasing. Changes, the willingness to purchase goods through the Internet will be further enhanced.
Figure 14 China online shopping market transaction scale 2011-2018
|
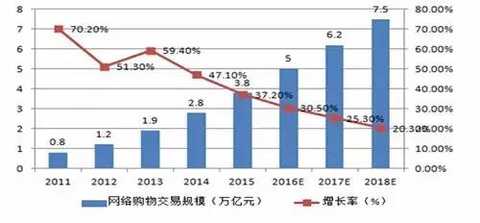
Source: China Industry Information Network, Peng Yuan finishing
The near-breeding peak and the full liberalization of the second-child policy will unlock the potential of the children's wear market. From the perspective of the industrial life cycle, China's children's wear industry is still in the growth stage, with the characteristics of rapid market demand growth and increased growth space. According to the sixth national census data, China's population aged 0-14 is 222 million, accounting for 16.6% of the total population, including about 100 million urban children. This part of the population is currently the main group of children's wear; meanwhile, the last century 80 The age is the third birth season in China, with a total population of 220 million, which is the third baby boom in China. The average age of marriage for men and women in China is 25.5 and 23.5, respectively. According to the National Bureau of Statistics, the peak fertility rate in China is 20-34 years old, with 25-29 years old being the highest. The baby boom in 1985-1995 will enter the marriage and birth stage. The number of marriage registrations is about 11 million pairs per year, and China will welcome the fourth baby boom. The number of children determines the consumption capacity of the children's wear market. In recent years, the scale of children's wear in China has been expanding and maintaining a high growth rate. According to the "2016-2021 China High-end Children's Wear Industry Research and Investment Prospect Forecast Report" issued by the China Business Research Institute, it is estimated that with the opening of the second child and consumption upgrade, it is expected that the scale of China's children's wear market will exceed 180 billion yuan by 2020. Affected by rapid growth in demand, the price of children's wear continued to rise. According to the China National Business Information Center, the unit price of children's wear in key national large-scale retail enterprises increased by 19.4% from 2011 to 2015, an average annual increase of 4.5%.
Figure 15 Size of the children's wear market
|
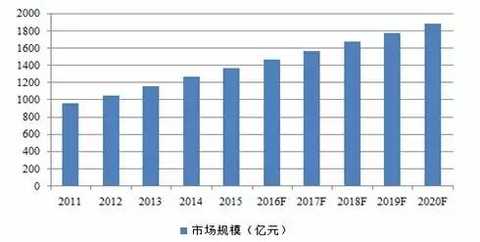
Source: China Merchants Research Institute, Peng Yuan
Third, the analysis of financial risk changes in the industry
(1) Data selection
We selected 15 companies that have issued bonds in the apparel and home textile industry as of September 30, 2016 as a sample of analysis (hereinafter referred to as “sample companiesâ€, see Appendix).
(II) Analysis of changes in corporate financial risks
The overall debt growth rate of the garment and home textile industry continued to decline, and the degree of debt management also showed a downward trend. However, the degree of debt management of enterprises with strong financing ability in the industry has increased, and the pressure on debt repayment has increased.
Since 2008, the scale of debt financing in the textile and garment industry has continued to expand, and the growth rate of debt scale has been positive. As of the end of June 2016, the average debt scale of the whole industry was 37,743,300 yuan. From the perspective of the growth rate of debt scale, the growth rate of debt scale increased year by year in 2009-2011, and the growth rate of debt scale after 2012 decreased year by year. In terms of asset-liability ratio, since 2008, the asset-liability ratio of the textile and garment industry has continued to decline, and the operating level of the entire industry has shown a downward trend.
Figure 16 China's textile and apparel industry liabilities in recent years (unit: %)
|
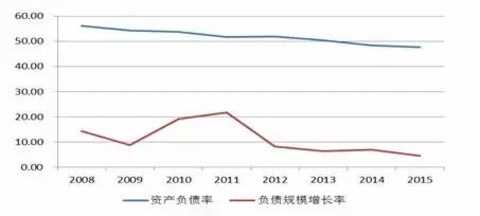
Source: wind information, China Industry Information Network, Peng Yuan finishing
In terms of sample enterprises, from the perspective of the scale of liabilities, the average size of the 15 sample companies selected was larger, and the growth rate of debt scale increased year by year. The average debt scale at the end of 2015 reached 5.938 billion yuan, an increase of 29.22% over the previous year. . From the perspective of asset-liability ratio, in recent years, the average asset-liability ratio of sample companies has also increased year by year. As of the end of 2015, the average asset-liability ratio was 47.14%, an increase of 4.09 percentage points over the previous year, and the degree of debt operation has increased. Regardless of the growth rate of debt scale or asset-liability ratio, the performance of sample companies is opposite to that of enterprises in the whole industry. We believe that the sample companies are mostly high-quality enterprises in the industry, with strong comprehensive competitiveness and business expansion demand. Large, and its ability to conduct debt financing through banks or capital markets, and lower financing costs also encourage enterprises to have more incentives to operate debt.
Figure 17 Debt and asset-liability ratio of sample companies in recent years
|
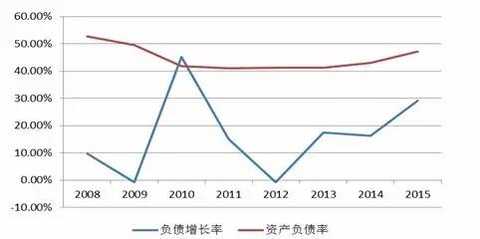
Source: wind information, Peng Yuan finishing
The sample enterprises belong to the higher-quality enterprises in the industry, and their debt financing ability is strong. The expansion of debt financing scale leads to an increase in the degree of debt management, resulting in a weakening of corporate solvency indicators and an increase in debt repayment pressure.
Figure 18 Sample business flow ratio and quick ratio in recent years
|
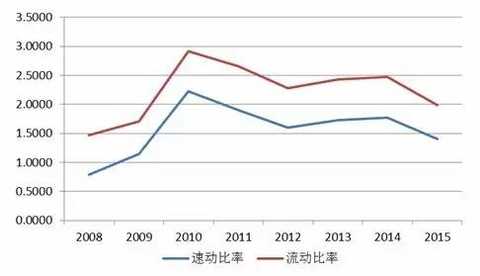
Source: wind information, Peng Yuan finishing
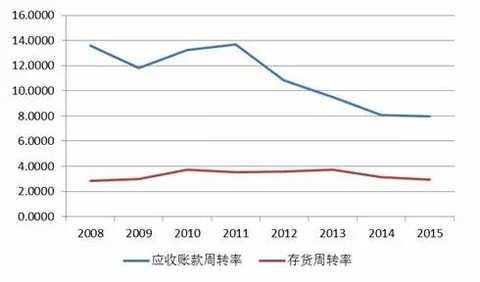
The inventory turnover rate and accounts receivable turnover rate of clothing and home textile industry have decreased, and the efficiency of asset operation has decreased.Affected by factors such as slowing domestic and overseas market economic growth, exchange rate fluctuations, trade frictions, etc., the market demand for textile and garment industry has weakened. As a result, in recent years, the scale of inventory in enterprises in the textile and garment industry has increased, and the inventory turnover rate has increased. Declining; from the perspective of accounts receivable turnover, in recent years, the turnover rate of textile and apparel receivables has declined slightly, and downstream customers have taken up certain accounts for the industry.
Figure 19 In recent years, the receivables turnover rate and inventory turnover rate of the textile and apparel industry
|
Source: wind information, Peng Yuan finishing
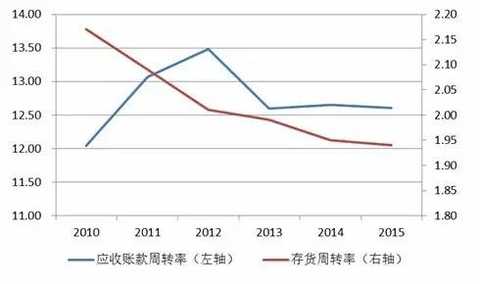
From the perspective of the accounts receivable turnover rate and inventory turnover rate of the sample companies in recent years, the turnover rate of the accounts receivables of the sample enterprises showed a downward trend after 2010, and the inventory turnover rate also decreased. In recent years, the sample companies are still actively expanding the market, which has led to a significant increase in the scale of inventory and accounts receivable. However, due to the weakening of market demand for clothing and home textile industry at home and abroad, the inventory turnover rate of sample enterprises has decreased, and the collection period of accounts receivable has been extended. Increased the pressure on corporate capital turnover.
Figure 20 Accounts receivable turnover rate and inventory turnover rate of sample companies in recent years
|
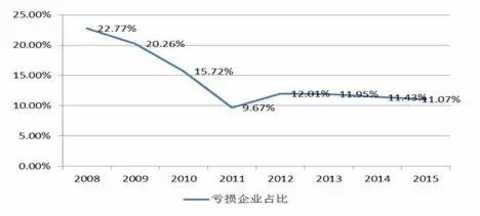
Source: wind information, Pengyuan finishing industry fierce competition makes the loss-making enterprises eliminated, high-quality enterprises can develop, and rising costs, weakened demand, the gross margin of clothing and home textile industry is reduced, profitability is weakened
In the textile and garment industry, the concentration of enterprises in the textile and garment industry is relatively low. From 2008 to 2010, due to the influence of the market environment, some loss-making enterprises were gradually eliminated, which caused the proportion of losses in the textile and garment industry to account for the total number of enterprises, from 22.77% in 2008. It fell to 9.67% in 2011. After 2011, the proportion of loss-making enterprises in the textile and garment industry accounted for a relatively stable proportion of all industries, maintaining around 11%.
Figure 21 The proportion of loss-making enterprises in the textile and garment industry in recent years
|
Source: wind information, Peng Yuan finishing
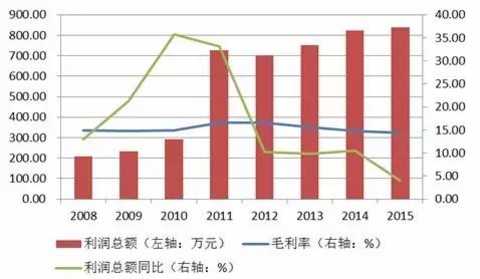
In recent years, the rising prices of raw materials in the textile and garment industry and the increase in labor costs have reduced the profit margin of the industry. After 2012, the gross profit margin of the textile and apparel industry has been declining year by year, and the profitability of enterprises in the industry has been declining year by year. In 2015, the gross profit margin of the textile and apparel industry was 14.38%, down 0.4 percentage points year-on-year. Judging from the average total profit of enterprises in the industry, in recent years, the total profit of the industry has increased. Especially after the elimination of some loss-making enterprises in 2010, the total profit has increased significantly, but from the perspective of the growth rate of total profit, it is affected by the macroeconomic slowdown. The slowdown in consumption growth and the intensification of competition in the industry have led to a decline in the growth rate of total profit. The growth rate of total profit in 2015 has dropped to the lowest level in history, only 4.00%, down 6.55 percentage points year-on-year.
Figure 22 Gross profit margin of textile and apparel owners' business in recent years
|
Source: wind information, Peng Yuan finishing
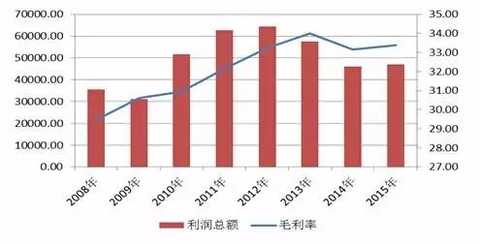
Judging from the selected sample enterprises in the home textile industry, in 2009-2012, in the context of eliminating losses and lagging enterprises in the industry, the sample enterprises are stronger due to their strength, and the total profit and gross profit rate are increasing year by year. After 2012, Affected by factors such as slower domestic and international market growth, increased competition, exchange rate fluctuations, trade frictions, rising raw material prices and increased labor costs, the average gross profit and gross profit margin of sample companies have declined, but the overall gross profit margin is still relatively high. Larger than the industry average.
Figure 23 Total profit and gross profit margin of sample companies in recent years (10,000 yuan, %)
|
Source: wind information, Peng Yuan finishing
Analysis of the distribution and changes of industry credit ratings in 2016
(1) Distribution and migration of industry credit ratings
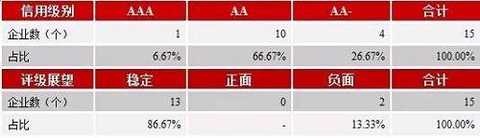
In 2016, the main credit rating of 15 major bond issuers in the apparel and home textile industry was concentrated between AA-~AAA, of which one was AAA, accounting for 6.67% of the total sample; 10 were AA, accounting for the sample. The total number is 66.67%7; the four grades are AA-, accounting for 26.67% of the total sample.
The main credit rating of the 15 major bond issuers in the apparel and home textile industry is positive; the stable 13 accounted for 86.67% of the total sample; the negative 2 accounted for 13.33% of the total sample.
Table 2 The main credit rating and rating outlook of major bond companies in the apparel and home textile industry
|
Source: wind information, Peng Yuan finishing
In 2016, among the 15 major bond issuers in the apparel home textile industry, one company that issued the first bond issue (Jiumuwang Co., Ltd.) was excluded, and the main credit level migration matrix of the remaining 14 companies was made. None of them changed.
Table 3 Main body level migration matrix of apparel home textile industry in 2016
Source: wind information, Peng Yuan finishing
(II) Reasons for the migration of industry credit ratings
In terms of credit rating, in 2016, the level of the clothing and home textile industry has not changed. Although the textile apparel industry has brought a negative impact on the credit quality of companies in the industry demand growth, competition and cost, but the basic corporate bonds for the industry of high-quality business, a strong majority of enterprise competitiveness, profitability still Well, the overall operation is relatively stable.
From the rating outlook, there are two companies whose rating outlook is downgraded to negative. Among them, Shanghai Meters? Bangwei Clothing Co., Ltd. (hereinafter referred to as “Meibang Apparelâ€) was affected by the intensified market competition in 2015, and closed some stores, which caused the company’s operating income and gross profit to continue to decline, while the period cost was high. The company's total profit has suffered losses; Shanghai Jialinjie Fabric Co., Ltd. (hereinafter referred to as "Jialinjie"), the company's self-operated brand in 2015 due to high operating costs, and the capacity to digest a certain pressure, resulting in a loss of the company's total profit .
V. Industry Credit Outlook
From the perspective of demand, due to the impact of macroeconomic downturn and household consumption structure adjustment, the growth rate of consumer demand for domestic apparel home textile products has slowed down. In addition, after the financial crisis, the US, Europe, and Japan have experienced slow economic recovery, and garment processing and manufacturing Due to factors such as low-cost country transfer and trade friction, in recent years, China's garment and home textile industry is facing greater pressure on exports, and the growth rate of export volume has slowed down year by year. Overall, the growth rate of demand for apparel home textile products in China has weakened.
From the perspective of market competition, due to the low barriers to entry in the apparel and home textile industry, the number of companies in the industry is large, the industry concentration is low, and industry competition is intensifying. In terms of cost, the prices of apparel fabrics and apparel accessories in China are generally on the rise, while rents, channel fees and labor costs are increasing. Affected by weakening demand and increasing costs, China's garment and home textile industry's gross profit margin has declined, and its profitability has weakened. However, high-quality enterprises in the industry still maintain strong profitability; at the same time, industry inventory turnover rate and accounts receivable turnover The rate has dropped.
The overall debt growth rate of the garment and home textile industry continued to decline, and the degree of debt management also showed a downward trend. However, due to the strong financing ability and low financing costs, and the demand for business expansion, the quality enterprises in the industry have some degree of debt management. Ascending, the pressure on debt repayment has increased.
The development of e-commerce will prompt the enterprises in the apparel home textile industry to open up new sales channels, and the liberalization of the second-child policy will bring certain development opportunities for clothing and home textile enterprises in related fields.
Tencel Fabric,Indistinct Flower Fabric,Palm Leaf Printed Fabric,Pink Flowers Fabric
Shaoxing City Jiaren Textile Co., ltd. , https://www.jiarentextile.com